Ten deterministic evaluators
exact_match, contains, contains_all, contains_any, regex, json_valid, non_empty, length_bounds, levenshtein, numeric_tolerance. No model in the loop, so a score is reproducible.
Point your OpenInference or OTel exporter at localhost:4318.
evald normalises each span, fsyncs it to a write-ahead log before
acknowledging, compacts it into time-partitioned Parquet you can query with
DuckDB, and runs your evals against it. One static binary. No database,
no Python runtime, no container.
v0.2.0, Apache-2.0. A 42 MB binary that runs on a laptop, a CI runner or an air-gapped host.
Read this before the throughput table. A spans-per-second number means nothing on its own, because it is not a measure of the same promise. Here is what a 2xx actually commits to in each store this was benchmarked against.
| store | what a 2xx ACK means |
|---|---|
| evald | the span is fsynced to the WAL before the ACK, crash-safe at ACK |
| Phoenix | request parsed and queued; the insert happens async. Spans were still landing 20+ s after load stopped |
| OpenObserve | written to an in-process WAL buffer; fsync is periodic, not per-request |
Method: a Rust OTLP/HTTP load generator, protobuf
ExportTraceServiceRequest, LLM-shaped spans with globally
unique trace and span ids so no target gets an upsert or dedup
shortcut. 10 spans per request, 15 s measured after a 3 s warm-up,
keep-alive connections. “Accepted” means 2xx-ACKed;
429 and 503 sheds are counted separately and never as throughput.
Measured 2026-07-06 on one machine, one run per cell.
| spans/s accepted, 10 spans/req | 1 conn | 8 conns | 32 conns |
|---|---|---|---|
| evald, group-commit writer, native | 4,732 | 17,348 | 56,029 |
| evald, per-request fsync, before group commit | 4,719 | 5,150 | 5,261 |
| Phoenix, Docker, SQLite default | 1,053 | 160 | 128 |
| OpenObserve, Docker, single node | 18,747 | 103,468 | 248,555 |
It owns raw single-binary OTel ingest throughput and we do not claim that slice. It is also faster on latency at every concurrency we measured: a 0.5 ms p50 at one connection against evald's 2.0 ms, which is one NVMe fsync. What it does not do is fsync before acknowledging, so the two numbers are answers to different questions. evald's claim is the strongest ACK at per-core parity, not the biggest number. Against Phoenix, which sheds, evald under concurrency ingests roughly 50× Phoenix's best rate, the 1,053 spans/s it reaches at one connection before it starts refusing requests.
The hot-to-cold commit protocol was verified with a real kill -9
during compaction, the worst moment to die, because a segment is
half-moved between the log and the Parquet blocks. Spans come back from cold
Parquet plus WAL replay with no loss and no double-count.
Two sealed segments waiting; the compactor will move seg-000 into a block.
A span is durable before the client is told it was accepted. Nothing is acknowledged from memory.
A compactor flushes sealed segments to time-partitioned Snappy Parquet, with a redb trace_id index and a watermark, then truncates the log.
Those blocks are ordinary columnar files. Query them in DuckDB or pandas, or through evald's own DataFusion endpoint, where spans and scores join in one query.
429 with Retry-AfterBackpressure and shedding, with the sheds counted separately. It refuses work rather than dropping it silently.
evald eval run scores a JSONL dataset with deterministic
evaluators, persists every per-item and aggregate score, and exits non-zero
on a threshold regression. That much is a normal CI gate. The second gate is
the interesting one.
evald eval compare runA runB reads those persisted aggregates
back and diffs two runs by evaluator. With --fail-on-regression
it fails the build when a run gets worse, and with
--significance that gate becomes statistically honest: a
drop only fails the build when a dependency-free Welch's two-sample
t-test shows the (1 − α) confidence interval
excludes zero.
So sampling noise on a small dataset does not flag a phantom regression, and nobody learns to ignore the gate. The aggregate score carries the per-run n, mean and variance the test needs, which is why this works without a statistics runtime.
--significance, any drop fails.
exact_match, contains, contains_all, contains_any, regex, json_valid, non_empty, length_bounds, levenshtein, numeric_tolerance. No model in the loop, so a score is reproducible.
One universal Score object, from an eval, a human or the API, targeting a span, trace, session or run, stored durably. There is a Phoenix-compatible /v1/span_annotations endpoint so existing tooling keeps working.
A score is not a number in a spreadsheet next to a run id. It points at the span it judged, which is what makes the OTel-native join worth having.
Tier-3 LLM-as-judge is feature-gated, BYO-key and off by default; --estimate prices a run before any call. evald eval calibrate then measures the judge against your own human labels, offline, and can fail CI on drift.
The deployment model is the other half of the argument. A store you can put on a CI runner is a different product from one that needs six services.
| idle RSS | under load | CPU | at | |
|---|---|---|---|---|
| evald, native | 8.5 MB | 747 MB peak on a 1M-span burst, 276 MB after compaction | 1.8 cores | 59k spans/s |
| Phoenix | 436 MB | 549 MB and climbing: the queue | ~0.15 core | 726 spans/s |
| OpenObserve | ~170 MB | ~340 MB, flat | 5–9 cores | 245k spans/s |
Copy one static binary. evald serve --data-dir ./data. A laptop, a CI runner, an air-gapped host, a systemd unit, with nothing else to provision. 42 MB on disk, or a 133 MB distroless image.
A container, or pip install inside a Python environment. SQLite by default, Postgres for production. Python or a container either way. A 1.04 GB image.
Single binary or container for one node. Production is cluster mode, multiple nodes plus object storage plus etcd or NATS, or their hosted service.
Docker Compose or Helm: web, worker, Postgres, ClickHouse, Redis and MinIO. Or their cloud. It was not benchmarked; that footprint is the comparison.
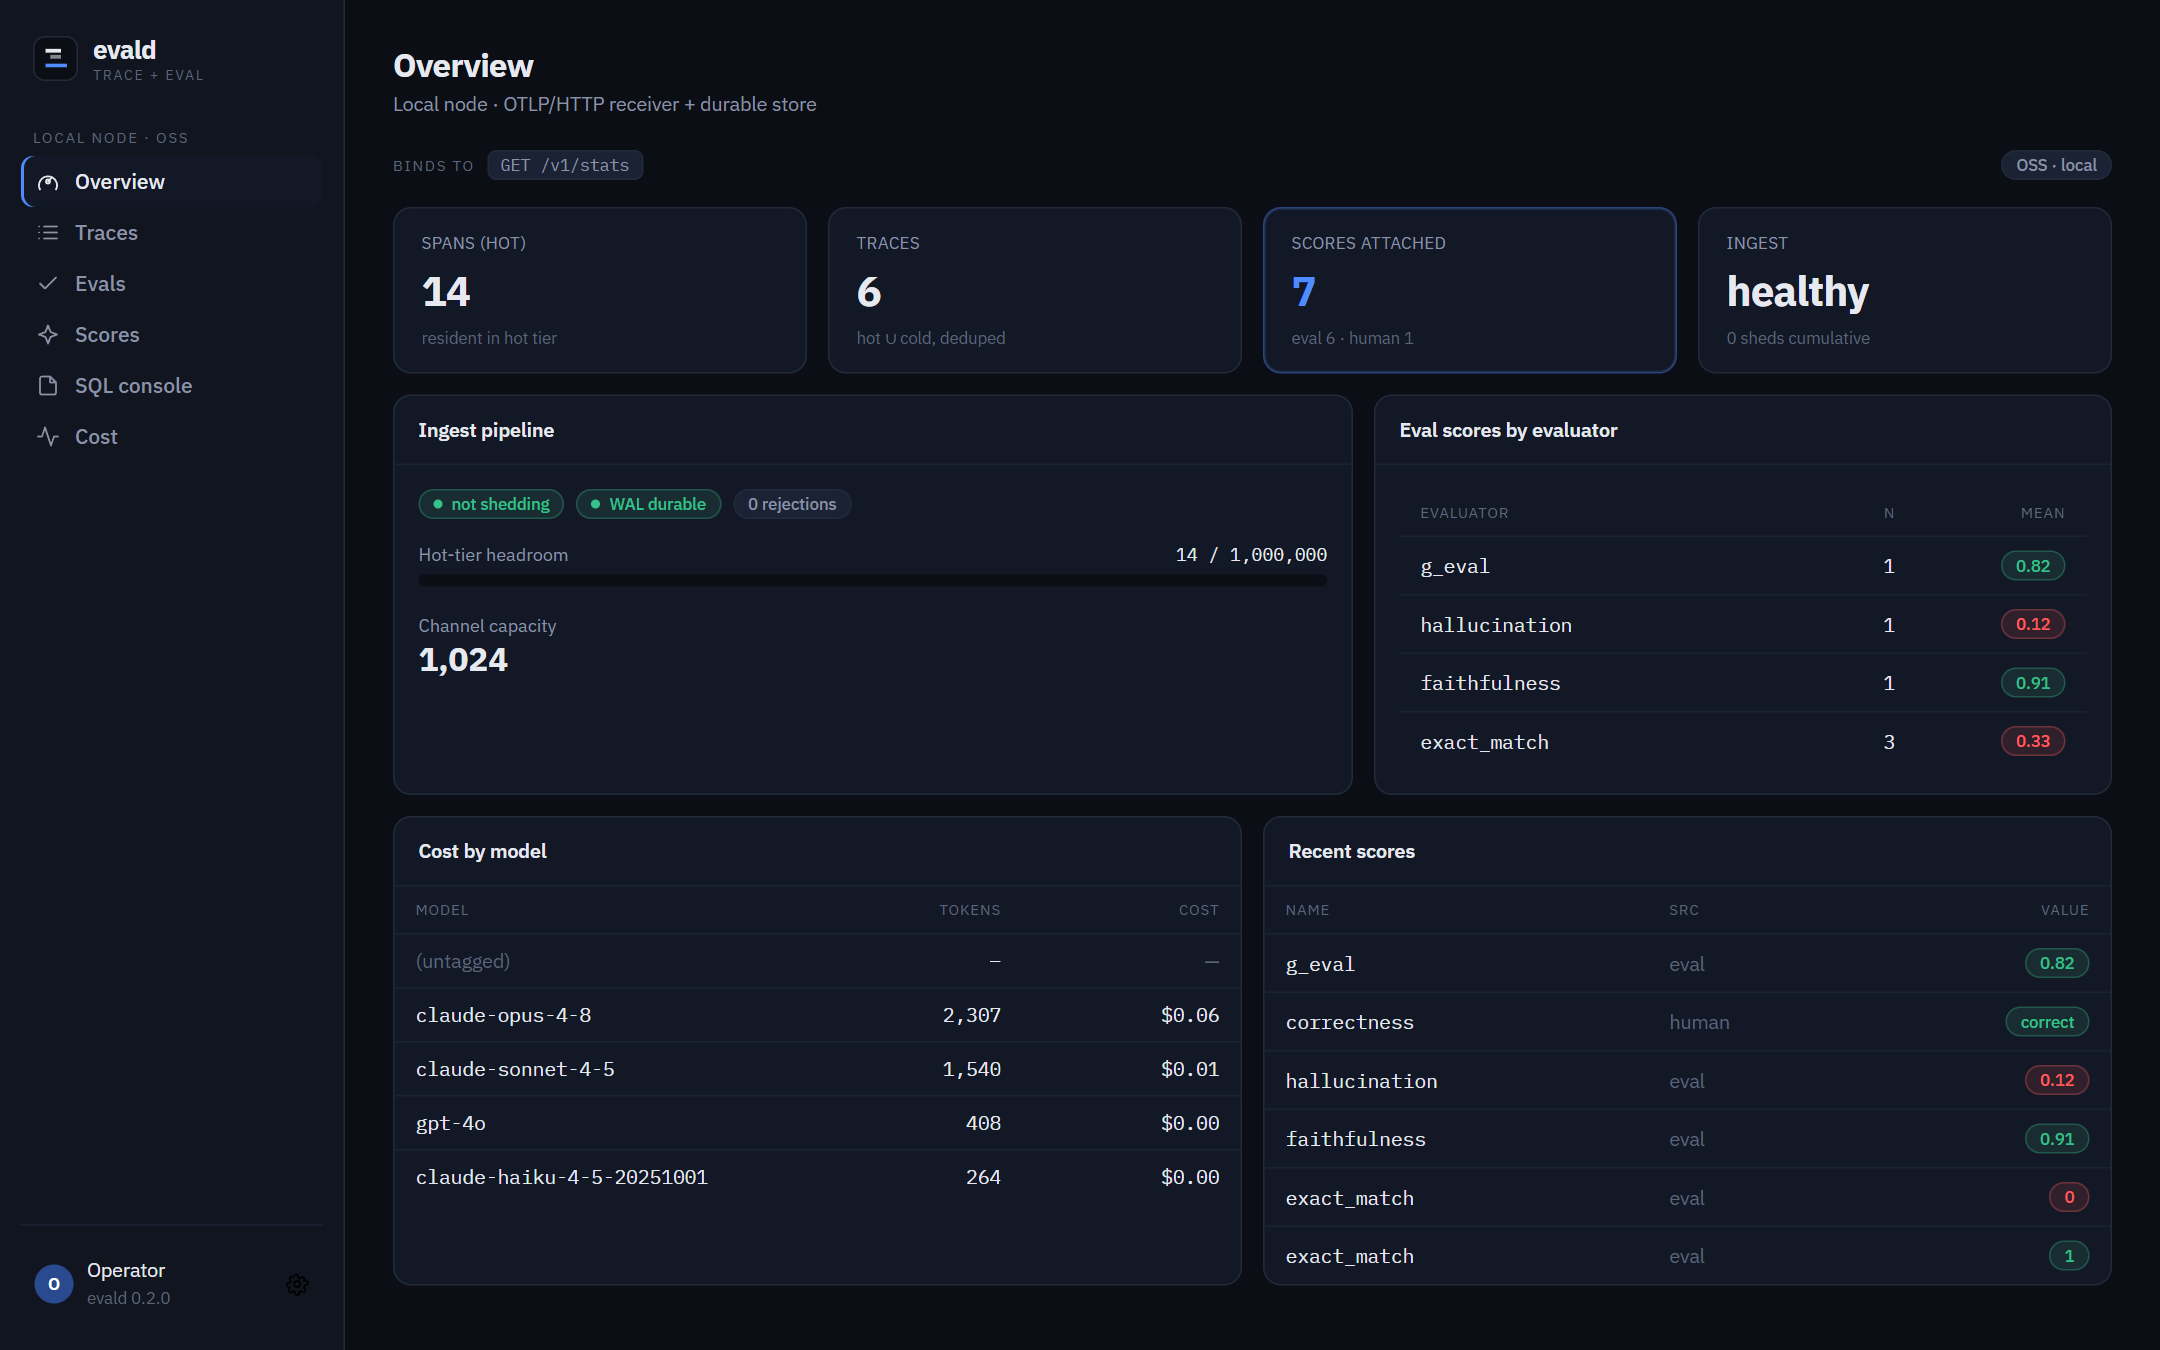
/ and working air-gapped. This is the
OSS console over the v0.2.0 binary, fed a handful of demo traces and scores over
OTLP. There is no separate front end to deploy or keep in version lockstep.
Merged and tested, not yet in a tagged binary. Build from source to have them today; they ship with the next release. None of it has been measured, so none of it carries a number here.
serve --redact email,credit_card,ssn,api_key
PII redaction on the ingest path, before the WAL append, so a detected value never reaches any tier. Redact, hash or drop. Off by default, because it is irreversible.
serve --retention 30d
Automatic retention with disk guardrails. Unset, nothing is ever deleted. A block is dropped only when every span in it predates the window.
GET /metrics, /healthz, /readyz
Prometheus exposition and Kubernetes probes. Spans ingested are counted at the fsync that commits a group, so the series tracks the durability boundary, not requests received.
GET /v1/traces/{id}/scores
Score rollup: what a trace scores when its spans are scored. A rolled-up value says it is derived, and an absent score stays absent rather than becoming zero.
serve --auth-token-file /etc/evald/tokens
A bearer-token gate for exposing evald off loopback. A shared secret, not TLS and not per-user identity; terminate TLS at a proxy in front of it.
tests/soak.rs
A soak test on every push: sustained ingest, repeated kill -9 recovery and compaction under load, checking the count stays exact across crashes, not just after one.
evald-fleet is the commercial line, under the Elastic License 2.0. It is not a
bigger engine. It is a control plane composed around unmodified Apache-2.0
nodes over a wire contract: the open node imports no fleet code, and the open build
stays air-gap-capable. The gateway authenticates before it routes, shards on
trace_id so a trace never splits, and answers 200 only after every
shard has fsynced. A 2xx from the fleet means what it means from one node.
/v1/fleet/lag
says how far behind each node is instead of implying it is current.
tenant
Hard multi-tenant isolation. The tenant prefix under the fleet root is the boundary, and a tenant context is minted only from a verified principal, so a key cannot be derived for a tenant nobody authenticated as.
auth, rbac
Provisioned bearer tokens, or OIDC with RS256 and a JWKS read from a file for air-gapped clusters or from an endpoint. Roles Viewer, Member, Admin, Owner, fail-closed and project-scoped: reading needs Viewer, ingest needs Member.
fleet-query
One SQL surface, one REST surface and the same console over every node's committed blocks, with the same spans and scores tables as a single node.
fleet-audit verify
Every decision on the gateway, the query node and the uploader is one record in an append-only, hash-chained ledger, verifiable offline. The query plane refuses to serve a request it cannot audit; the ingest plane prefers availability and logs loudly instead.
/v1/judge/anthropic
Managed judge keys: the tenant never holds a provider key. The unmodified OSS judge points at the gateway with the fleet token as its API key. This is the one metered unit.
Fleet, Tenants, Members, Billing, Audit, Judge keys
The same embedded console, with those six views lit on a fleet node. The open build's bundle does not contain them.
| evald, Apache-2.0 | evald-fleet, Elastic License 2.0 | |
|---|---|---|
| The store | fsync before the ACK, WAL to Parquet, crash-safe | the same nodes, byte for byte; the gateway ACKs after every shard fsyncs |
| Traces, scores, SQL, console | on the node | on the node, and once more over every node at fleet-query |
| Evaluators and the significance gate | all of it | all of it |
| LLM-as-judge | your own key, off by default | managed keys through the gateway, metered by token |
| Authentication | loopback by default; an optional bearer-token gate | bearer tokens or OIDC, roles, per tenant and project |
| More than one node | independent nodes behind an OTel Collector load-balancing exporter, free | a trace-sharded gateway, consolidated blocks, fleet-wide lag |
| Audit | operational logs | a hash-chained ledger per component, verified offline |
| Install | one binary | a Helm chart, a Terraform module, a compose reference; a private image, cosign-signed |
| Price | free, forever | per seat; only managed judge tokens are metered, never a trace |
The row that matters is the last one. The offline path, ingest, storage, deterministic evals and both gates, is never metered, and a per-trace charge cannot be expressed in the billing model at all: the metered-unit type has no ingest, trace or eval variant.
Measured 2026-07-06 with the shipped harness on one 4-vCPU container, every process sharing the same cores. The benchmark document says the multi-node cells therefore measure contention, not scaling, and so does this page. What one small box can measure honestly is the gateway's price and the analytics-isolation win.
| ingest, spans/s accepted, fsync-durable at ACK, 32 conns | spans/s | p50 ms | p99 ms |
|---|---|---|---|
| one open node, direct | 59,977 | 4.58 | 16.45 |
| through fleet-gateway to one node | 48,416 | 5.49 | 19.75 |
| through fleet-gateway to three nodes, on the same four cores | 35,067 | 7.78 | 26.59 |
Bearer to verified principal, RBAC, entitlement, one audit record per request, an OTLP decode and re-encode, and one more network hop. The ACK semantics and the backpressure survive it: a node's 429 propagates with its Retry-After. The three-node row is smaller still because three nodes, the gateway and the load generator oversubscribe four cores; on separate machines the same topology multiplies capacity, and a single box cannot demonstrate that.
| the same GROUP BY over 1.1 M spans, while the node ingests at full load | query, idle | query, under ingest | ingest while querying |
|---|---|---|---|
| on the ingesting open node | 132 ms | 806 ms | 47,623 spans/s |
| on fleet-query, same data, consolidated | 135 ms | 182 ms | 55,573 spans/s |
This is the measured win. Analytics on the node share its process and hot tier with the write path; on the fleet they read only the object store. With the query node on its own machine the ingest impact was zero: 59.6k spans/s during fleet-side queries, against 42.9k during node-side ones. Consolidation was exact, 633,243 spans, the sum of three cold tiers; a fleet-wide GROUP BY over 126 blocks answered in 50 ms.
Single-node k3s on a c5.2xlarge, everything sharing 8 vCPUs, bearer-authenticated through the gateway: 17,522 spans/s accepted with zero errors, p50 14.7 ms, p99 144 ms. Read it as a floor. Shards balanced to 138,451, 138,445 and 138,444 spans.
The node held 138,445 spans; the StatefulSet recreated it on the same volume and WAL replay restored exactly 138,445. With the default 30 s grace the replacement was hitless. A hard-down shard turns into gateway 503s for the window, because the gateway refuses to ACK what it cannot durably place.
About 22 MiB of RAM across five services. Under that load each node cost about 0.55 core and the gateway about 0.9; the query plane cost nothing during ingest, which is the isolation claim in numbers. 64,422 audit records were written and verified.
evald-fleet 0.1.0 is delivered as a private container image carrying
fleet-gateway, fleet-uploader, fleet-query and
fleet-audit, and as a Helm chart, both cosign-signed with a key rather than
a transparency log so verification works air-gapped. A Terraform module wraps the chart
with the namespace, the tokens secret and, for an s3:// root, the bucket and a
prefix-scoped policy. It runs on your cluster; there is no hosted service. Access is by
arrangement.
Every v0.2.0 release publishes musl and macOS archives for both
architectures, a Windows zip, an SPDX bill of materials, and a
SHA256SUMS carrying a Sigstore signature and certificate.
Download the v0.2.0 archive for your platform, verify it against the signed SHA256SUMS, and copy the one file inside it onto the box. That is the whole install.
Where a Rust toolchain or a container is allowed, those two work as well.
The receiver accepts POST /v1/traces in protobuf (gzip-aware) and OTLP-JSON, and normalises each span into one model unifying the OpenInference and gen_ai.* conventions, so you do not have to pick a convention first.
The benchmark harness ships in bench/: the same load
generator and the same fixed matrix, pointed at whichever store you want to
check. Including the one that beats us.